The ISMP Graph
Every three years, the Mathematical Optimization Society meets for its International Symposium of Mathematical Programming, or ISMP, which is the flagship meeting of mathematical optimizers throughout the world. This year the 22nd ISMP is being held July 12-17 in Pittsburgh.
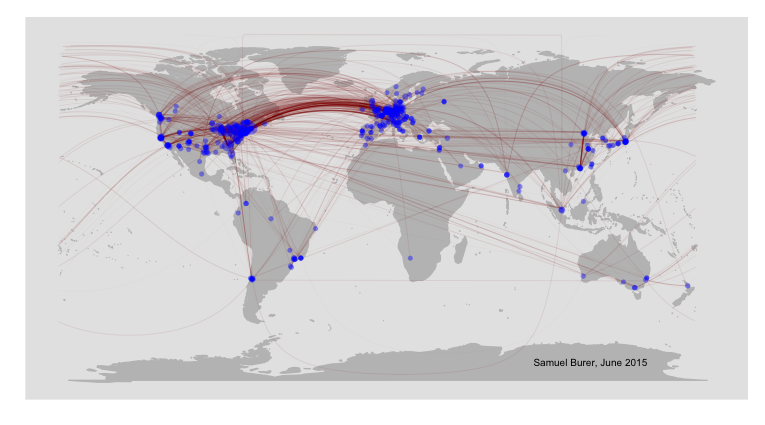
To visualize the contributions and connections between groups in the optimization community (just for fun!), I downloaded all of the program information for the 22nd ISMP. This included all sessions, all session chairs, and all presenters. I defined a group of participants to be those from the same institution (e.g., university or company) as determined by the domain name in a participants’s email address. (However, I ignored generic domains such as gmail.com.) Then, for each group, I counted how many sessions in which it participated, and for every pair of groups, I also counted how many sessions in which that pair participated together.
I then plotted the groups as points geographically with the point size indicating the group’s participation frequency, and I also drew great-circle connections to indicate the pairs that participated together. A connection’s thickness and opacity indicates the pair’s participation frequency. The final plot is shown below.
- Download the high-resolution PNG image.
- Download the SVG image.
- Download the R source code.